How the best performing Logistics Companies Track Execution Consistency in 2026

How do logistics companies track execution consistency? For most operations teams, the honest answer is: not well enough. A regional logistics network can touch hundreds of drivers, dispatchers, warehouse leads, and hub managers every single day. Despite that scale, most operations teams have no reliable way to know whether execution is actually consistent across all of them until something breaks. A late delivery report surfaces on Friday. A customer complaint lands on Monday. By then, the gap that caused both problems has already been widening for weeks.
The root issue is straightforward: traditional reporting tools show you what already happened. They don’t show you what’s drifting right now. That’s why a growing number of logistics leaders are pairing their existing TMS and ERP systems with execution intelligence platforms like PerkFlow, which surface variance in real time rather than in hindsight. Getting there requires the right KPIs, a reliable data flow, purpose-built visibility tools, and clear SLA thresholds. This article walks through all of it, plus a practical checklist to help you start measuring execution consistency at your first hub today.
How to Track Execution Consistency? Start With the Visibility Gap
The distributed visibility gap
Your hub in Dallas might be running at 97% OTIF. Your hub in Atlanta could be sitting at 88%. Most operations leaders won’t know that gap exists until a customer complaint triggers a manual review or a monthly scorecard gets assembled. Execution variance hides inside siloed systems: the TMS holds shipment records, the WMS holds pick accuracy data, and telematics captures driver routes, but none of those systems talk to each other by default. You end up with fragments of the truth scattered across platforms, with no single view showing where supply chain visibility is actually breaking down and where delivery performance metrics are drifting out of range.
Where manual audits fall short
Traditional methods like scheduled spot-check audits, weekly supervisor reviews, and shift-end paper logs capture a snapshot, not a pattern. A hub running 50 or more drivers per shift cannot rely on manual observation to catch execution drift before it compounds into missed SLAs and revenue erosion. These methods are reactive by design. By the time the audit cycle runs, the damage is already done. What logistics operations actually need is a monitoring system that flags deviations while there’s still time to act on them.
The KPIs That Actually Signal Performance
Service reliability and fulfillment quality metrics
The core KPI set for tracking execution consistency starts with four metrics: OTIF (on-time in-full), on-time delivery rate, order accuracy, and perfect order rate. OTIF captures whether the operation consistently meets the promised service level, measuring both the timing and completeness of each delivery. On-time delivery rate focuses purely on schedule reliability. Order accuracy measures whether items were picked, packed, and shipped without errors. Perfect order rate is the broadest of the four: it captures whether a delivery arrived on time, complete, undamaged, and with correct documentation all at once.
For benchmark targets, 95%+ OTIF is broadly recognized as strong performance in U.S. logistics, with top-tier networks aiming for 97% to 98%, a threshold referenced by supply chain organizations such as CSCMP. Order accuracy of 98% to 99% represents the “excellent” bar for fulfillment operations. On-time delivery rates between 95% and 98% indicate reliable schedule execution. If any of these delivery performance metrics consistently fall below 90%, that’s a signal of systemic execution issues, not isolated incidents.
Efficiency and exception metrics
Beyond the core service metrics, four additional KPIs reveal the texture of how consistently your operation runs. Dwell time and truck turnaround time measure how long vehicles spend at a facility, exposing loading, unloading, and staging inefficiencies that vary by hub and shift. First-attempt delivery rate shows how often execution succeeds without rework or exception handling.
Exception rate is one of the most direct signals of operational consistency: it measures the share of orders or shipments affected by delays, reroutes, cancellations, or damage. SLA and appointment compliance, along with proof-of-delivery compliance, act as process discipline indicators. They reveal whether your teams are following the defined playbook or improvising around it, a distinction that compounds quickly across a distributed network.
How to Build a Data Flow From Source Systems to a Unified Dashboard
Connecting your data sources
Reliable execution monitoring starts with knowing where your data actually lives. Logistics companies generally draw from four main event sources: TMS platforms (SAP TM, Oracle OTM, Blue Yonder) for shipment and route data; WMS systems for pick, pack, and dock events; telematics and IoT providers like Samsara, Motive, and Geotab for real-time vehicle and asset data; and EDI or API feeds from carriers, 3PLs, and trading partners. Each of these generates execution events in different formats, on different cadences, and with different levels of completeness. The challenge isn’t access to data. It’s getting those signals to talk to each other in a way that supports genuine supply chain visibility.
Normalizing events into a single view
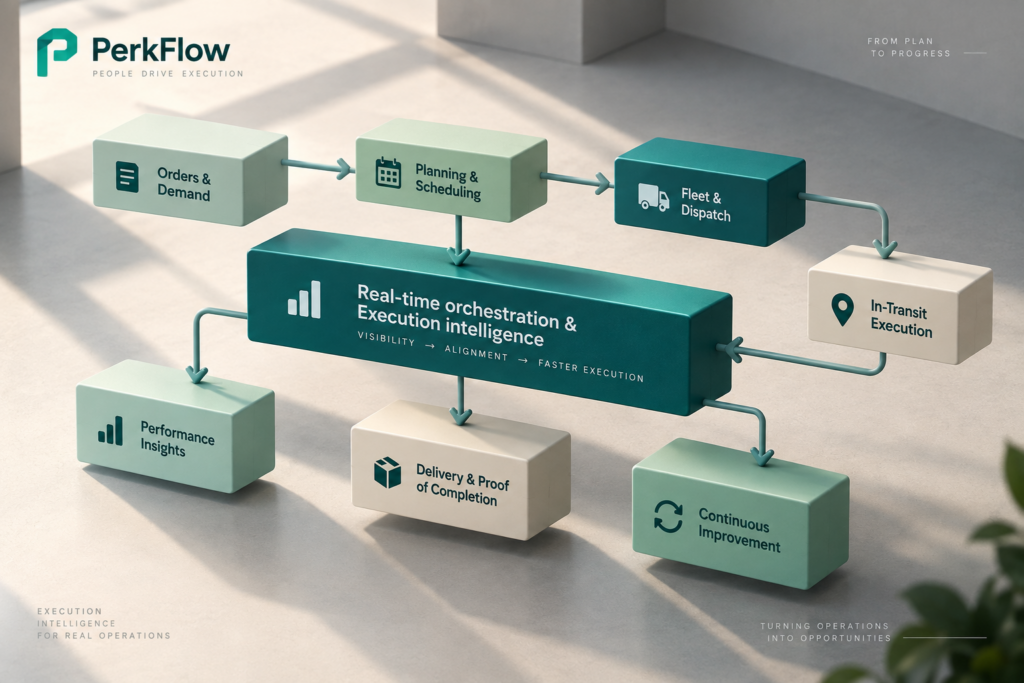
The integration architecture follows a consistent pattern: source feeds flow into an event broker (Kafka is a common choice), events get normalized into a common data model, and the curated data lands in a warehouse or operational dashboard. For this to work reliably, a few practical controls need to be in place:
- Deduplication prevents retries from creating phantom events.
- Latency checks catch missing carrier pings before they become blind spots.
- Master data matching reconciles shipment IDs and site codes across systems so events from different platforms tie to the same business object.
- Audit trails preserve source timestamps for SLA compliance monitoring and verification.
Even a well-structured spreadsheet can serve as the consolidation layer when you’re just starting out. The goal is a single view of execution by hub, team, and role, with source data feeding it consistently.
Tools Logistics Leaders Use to Track Execution Consistency
TMS and visibility platforms
Enterprise TMS platforms like SAP TM, Oracle OTM, Blue Yonder, and Descartes handle transportation planning and execution records well. Real-time freight visibility platforms like project44 and FourKites provide shipment-level tracking across carriers. These tools solve point-to-point visibility effectively, and they’re the right foundation for any logistics operation. What they don’t do is aggregate execution variance across hubs, driver teams, and ops roles in a single view. You can see that a shipment is delayed, but not that one hub’s exception rate is three times higher than another’s, or that a specific dispatcher team is consistently missing SLA thresholds.
The execution intelligence layer
This is the gap that platforms like PerkFlow are built to close. PerkFlow integrates with your logistics and work tools, pulling execution signals from across the stack and surfacing real-time variance by hub, team, or role. Unlike a BI dashboard that shows what happened last month, it detects execution drift as it happens, giving operations leaders the lead time to correct a consistency problem before it becomes an SLA breach. Think of it as the operational OS layer: a unified, real-time view of where execution is holding and where it’s starting to slip.
For distributed logistics networks, that kind of operational consistency isn’t optional. It’s what separates operations that catch problems early from those that discover them in a customer complaint.
Process Standardization and SLA Thresholds That Prevent Execution Drift
Building the standard into your operations
Tracking execution consistency is only useful if there’s a defined standard to measure against. Logistics operators use a consistent sequence to reduce variance: map core workflows (receiving, dispatch, shipment release, exception handling), then document current-state variation by site and shift. From there, write SOPs with exact step sequences and handoff criteria, and pilot at one hub before scaling. The standard has to be embedded into the system itself, through TMS and WMS required fields, routing rules, and status controls, so teams can’t bypass it through habit or workarounds. If the system allows a shortcut, experienced operators will find it. Build process compliance into the tool, not into hope.
Setting SLA alert thresholds
Alert thresholds need to notify teams when KPIs drift, not after they’ve already failed. A practical framework uses three levels for each metric: a target, a warning threshold, and a critical threshold.
For OTIF, that might look like 95% as the target, 92% as the warning level that triggers a supervisor alert, and 88% as the critical level that escalates to leadership. The goal is to create intervention windows: when a hub crosses the warning line, there’s still time to investigate and correct the root cause before the metric hits the floor. Regular audit cycles and root cause reviews keep the standard from drifting over time as team composition, routes, and volumes change.

A Practical Checklist to Start Tracking Execution Consistency Today
The setup sequence
The following steps move you from zero visibility to a working execution monitoring setup. Work through them sequentially, each step builds on the one before it.
- Select 5 to 7 core KPIs for your operation: OTIF, order accuracy, exception rate, dwell time, and first-attempt delivery rate are a strong starting set.
- Audit your current data sources: identify which systems capture each KPI event and in what format.
- Map your data flow from source systems to a consolidation layer. A spreadsheet is a legitimate starting point.
- Define industry-aligned benchmark targets for each KPI based on your network’s complexity and customer SLA requirements.
- Set SLA thresholds (target, warning, critical) for each metric and assign an owner to each alert level.
- Configure a dashboard or visibility tool that displays performance by hub, driver group, and team.
- Run a two-week pilot at one hub, compare results against benchmarks, and identify the top variance sources.
- Standardize the process across remaining hubs using SOPs, system controls, and regular audit cadences.
Ready to see how PerkFlow surfaces execution variance in real time? Set up a walkthrough with the PerkFlow team.
What to do once you’re tracking
Measurement alone doesn’t fix execution gaps. Once your monitoring system is live, the next step is building a feedback loop: reviewing hub-level variance weekly, routing insights to the right supervisors, and using execution data to guide coaching, training, and process updates. A report that sits in a dashboard unread is just noise. The value comes when the right person sees the right signal at the right time and knows exactly what to do about it. This is where the practical difference between a reporting tool and an execution intelligence platform becomes visible in day-to-day operations.
Consistent Execution Is a System, Not a Goal
Understanding how logistics companies track execution consistency comes down to four things working together: the right KPIs, a reliable data flow from existing source systems, tools that surface variance in real time, and process controls that prevent drift from compounding before anyone notices. The companies that get this right don’t necessarily have the most sophisticated tech stacks. They have clarity on what consistent execution looks like at every hub, a system that flags deviations before they become SLA failures, and a team that knows exactly what to do when the numbers move.
PerkFlow makes that operational clarity accessible without requiring you to overhaul the tools already in place. It layers over your existing TMS, ERP, and communication platforms to deliver a unified, real-time view of where execution is holding and where it’s starting to drift. Start with one hub. Pick your core KPIs. Take an honest look at where your execution variance is actually hiding. That’s enough to build from.
To see execution consistency in real time across your network, set up a walkthrough with the PerkFlow team.
 Written by Steve Mbenoun